Modern businesses operate in an environment saturated with data. Every marketing campaign, supply chain checkpoint, customer service interaction, and financial transaction generates telemetry. Yet, according to recent industry benchmarks, enterprise data analysts still spend up to 60% of their working hours manually extracting, formatting, cleaning, and consolidating data into static spreadsheets before any actual analysis begins.
This traditional, manual approach to business intelligence is a costly bottleneck. It is prone to human error, scales poorly, and forces executive leadership to make critical pivot decisions based on delayed, backward-looking reports.
AI automation for analytics and reporting entirely redefines this landscape. By shifting the computational burden from human operators to intelligent autonomous pipelines, organizations can process massive datasets instantly, uncover deep semantic trends, and deliver real-time, predictive reporting dashboards. This masterclass guide outlines the structural shift from legacy reporting to automated intelligence, profiles the premier tools driving the industry, details core enterprise use cases, and provides a step-by-step framework for deployment.
1. The Paradigm Shift: Legacy BI vs. GenAI Analytics
To implement an elite data framework, it is necessary to first understand the structural evolution of reporting platforms over the past decade.
| Feature Metric | Legacy Business Intelligence | Modern AI Automation Pipelines |
|---|---|---|
| Data Ingestion | Manual CSV exports, fragile cron-job scripts, and siloed database queries. | Continuous, API-driven webhooks and autonomous stream ingestion. |
| Data Cleansing | Human manipulation via Excel macros, VLOOKUPs, and formula matching. | Algorithmic data normalization and semantic schema mapping. |
| Insight Extraction | Descriptive (What happened last month?). Requires manual chart creation. | Predictive & Prescriptive (What will happen next, and what should we do?). |
| Interface Layer | Static PDF presentations, slide decks, or rigid, unpromptable dashboards. | Natural Language Interfaces (NLIs) enabling conversational data queries. |
Legacy Business Intelligence (BI) relies entirely on predefined rules. If an executive wants to cross-examine web performance against operational overhead, an analyst must write SQL queries, normalize the dates, and plot a new line graph.
Conversely, Generative AI and Large Language Models (LLMs) treat data textually and contextually. Armed with advanced code interpreter environments, modern AI engines write code on the fly to inspect underlying databases, compute variances, clean null values, and present multi-dimensional graphs instantly based on simple conversational prompts.
2. Structural Benefits of Automating Analytics Workflows
Transitioning from manual extraction to automated cognitive processing delivers immediate operational returns:
- Unmatched Analytical Velocity: Data that used to take three business days to compile across separate global offices is pulled, parsed, and pushed into visualization panels within seconds.
- Eradication of Human Error: Automating data cleaning removes the risks of broken formulas, misaligned cells, and transcription oversights.
- Democratization of Data: By implementing conversational interfaces, non-technical cross-functional team leaders can extract deep data insights without overwhelming data science teams.
- Proactive Outlier Detection: AI models monitor data streams constantly, automatically flagging anomalies, performance drops, or budget spikes as they happen rather than at month-end review.
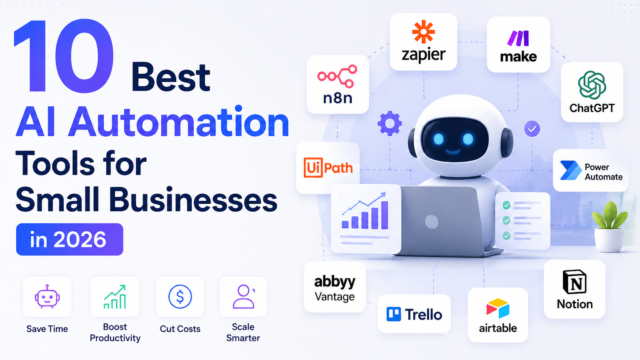
3. In-Depth Review of the Top 10 Analytics Automation Tools
Choosing your analytics automation stack requires looking closely at your scale, security, and native software ecosystem. Here is an evaluation of the industry’s top solutions:
1. Microsoft Power BI + Copilot
Target Audience: Enterprise corporations utilizing the Microsoft ecosystem.
Core Architecture: Direct DAX integration, Azure Synapse analytics, and native generative AI helpers.
Deep Dive: Power BI remains a cornerstone of enterprise operations. With Copilot natively embedded, users can generate complex data models, create entire reporting dashboards, and build complex calculation measures simply by typing natural language requests. It integrates seamlessly with internal Dataverses and Azure infrastructure.
Best For: Deep internal corporate reporting inside Windows/Microsoft ecosystems.
2. Tableau Pulse (Salesforce)
Target Audience: Modern, metric-driven companies and sales organizations.
Core Architecture: Powered by Salesforce Einstein, offering metric-centric automated delivery layers.
Deep Dive: Tableau Pulse shifts the analytics experience away from looking at giant, overwhelming dashboards. Instead, it proactively pushes customized, bite-sized metric summaries right to your workspace in Slack or email. It uses generative AI to explain the “why” behind data changes, instantly pointing out anomalies and tracking goals.
Best For: Sales and product managers who need immediate, easily digestible answers to specific growth metrics.
3. Akkio
Target Audience: Performance marketers, digital agencies, and lean operations teams.
Core Architecture: Low-code predictive modeling and automated generative text-to-data suites.
Deep Dive: Akkio is purpose-built for teams that want to leverage machine learning without writing python scripts. Users upload data tables or connect live sources like HubSpot, configure a target parameter (e.g., lead scoring or churn risk), and Akkio’s AI automatically trains a predictive analytics model in minutes.
Best For: Marketing agencies needing to build predictive lead scores and operational forecasts fast.
4. Polymer Search
Target Audience: Content creators, small-business owners, and marketing managers.
Core Architecture: An AI-driven spreadsheet data engine that automatically builds interactives.
Deep Dive: Polymer takes raw, unorganized CSV files and spreadsheets and converts them into searchable, interactive, web-ready data hubs. It reads your data structure and instantly suggests the most effective visualization charts, interactive tags, and layout filters without requiring any configuration.
Best For: Transforming boring spreadsheets into beautiful, interactive, user-facing analytical presentation grids.
5. Julius AI
Target Audience: Researchers, advanced financial analysts, and enterprise data consultants.
Core Architecture: Advanced LLM reasoning layer coupled with an autonomous Python code sandbox.
Deep Dive: Julius AI operates as an elite, virtual data scientist. Users connect live databases or upload files, and Julius uses its reasoning capabilities to write and execute code, clean messy datasets, run regression analyses, and design advanced statistical models through simple chat instructions.
Best For: Granular, complex statistical data analysis and open-ended research tasks.
6. MonkeyLearn
Target Audience: Customer experience (CX) and product design departments.
Core Architecture: Specialized NLP models built specifically for unstructured text categorization.
Deep Dive: MonkeyLearn focuses on text analytics automation. It cleans unstructured customer inputs—like raw support tickets, social media mentions, and public product reviews—and automatically assigns sentiment scores, extracts key topic tags, and creates rich visualization grids.
Best For: Automating qualitative customer feedback sentiment analysis pipelines.
7. Zapier (AI Data Pipelines)
Target Audience: Startups, automation engineers, and SMB operators.
Core Architecture: Low-code API hooks combined with multi-step generative assistant steps.
Deep Dive: Zapier serves as the crucial glue connecting disconnected data tools. It allows users to capture performance metrics from platforms like Facebook Ads or Stripe, pass those numbers through generative prompts to extract key insights, and automatically push structured data directly into database systems. Learn how to optimize these foundational workflows in our comprehensive Zapier Review.
Best For: Connecting web apps to build lightweight, highly adaptable data-handling pipelines.
8. Google Looker Studio (with Gemini)
Target Audience: Digital marketers, SEO agencies, and media buying teams.
Core Architecture: Native BigQuery and Google Marketing Platform data stream integration.
Deep Dive: Looker Studio excels at unifying cross-channel marketing streams into cohesive dashboards. Boosted by Google Gemini, the platform automates data transformations and lets users quickly generate calculated fields and build rich marketing reports via conversational prompts.
Best For: Unifying GA4, Google Ads, and search console statistics into elegant client portals.
9. Sisense (Fusion Analytics)
Target Audience: Product development managers and software-as-a-service (SaaS) teams.
Core Architecture: Highly scalable cloud-native analytics architecture built for API embeddings.
Deep Dive: Sisense allows software organizations to embed advanced analytics dashboards directly into their own user-facing applications. Its built-in AI models enable natural language querying and automated anomaly alerts natively within custom software layouts.
Best For: Embedding white-labeled analytics platforms into commercial SaaS portals.
10. Domo
Target Audience: C-Suite executives and cross-departmental operations managers.
Core Architecture: All-in-one low-code data app platform featuring a robust cloud data integration engine.
Deep Dive: Domo integrates huge datasets from any corporate location—including legacy databases, cloud storage, and on-premise ERP platforms—into a unified executive viewport. Its AI features continuously monitor operations to automatically predict business trajectories, alert managers to inventory drops, and generate corporate briefings.
Best For: High-level real-time data visibility across massive, fragmented global operations.
4. Core Enterprise Use Cases Across Departments
AI analytics pipelines break down old data silos, introducing operational efficiency across several distinct business functions:
Marketing & Sales Performance Orchestration
Instead of manually downloading performance data across Meta, Google Ads, and LinkedIn, an automated pipeline retrieves campaign data daily, groups the data by target audience, calculates accurate customer acquisition costs (CAC), and adjusts ad budgets automatically based on performance. For a closer look at structuring the foundational document systems feeding these loops, read our guide on AI Automation for Data Entry.
Financial Modeling & Predictive Revenue Reporting
Financial divisions deploy AI pipelines to monitor accounts receivable, ledger lines, and operational spending. These systems calculate exact run rates, spot billing errors, and automatically generate cash flow forecasts for upcoming quarters, eliminating spreadsheet maintenance.
Supply Chain Tracking & Predictive Logistics
By connecting warehouse data, shipping manifests, and sales histories, automated engines predict incoming stock constraints, identify transit slowdowns, and generate proactive reorder notifications before shortages occur.
5. Step-by-Step Architecture: Building a Predictive AI Reporting Pipeline
To implement an elite automated reporting loop, design your system architecture following these four essential data stages:
- Unified Data Ingestion Layer: Create automated pipelines using tools like Zapier or Fivetran to pull data from your disparate operational tools (such as CRMs, web apps, or support desks) and route it into a centralized database or data lake.
-
Autonomous Processing & Cleaning Core:
Route the data payload into an advanced processing engine (like Julius AI or an enterprise cloud function). The system cleans missing fields, standardizes naming across platforms, and calculates required metrics:
{ "pipeline_status": "Normalized", "data_metrics": { "reporting_period": "Q2_2026", "total_ad_spend": 24500.00, "attributed_revenue": 98400.00, "calculated_roi_multiplier": 4.01 } } - Machine Learning Insight Generation: Pass the organized metrics through a predictive model (such as Akkio) to identify underlying performance trends, project future conversion dates, and flag anomalies.
- Proactive Insight Delivery: Push the generated reports out to your team. Rather than waiting for someone to log into a dashboard, have the pipeline send concise summaries directly to your communication channels (like Slack or Microsoft Teams) or email alerts.
6. Overcoming Hurdles: Data Governance, Privacy, and Hallucinations
Deploying advanced AI models requires setting up strict safeguards to prevent errors and ensure compliance:
- Ironclad Data Security & Privacy: Passing proprietary financial or sensitive customer metrics through public AI APIs poses severe security risks. Always choose enterprise solutions that guarantee data isolation, meet SOC 2 Type II standards, and state explicitly that your private data won’t be used to train public foundational models.
- Mitigating LLM Hallucinations: Generative models are outstanding at summarizing text but can occasionally hallucinate incorrect mathematical figures. Never allow an unmonitored LLM to handle raw calculations without wrapping it in strict validation loops that cross-check the output metrics against raw database sums.
- Evolving Global Compliance: Modern analytical tools must conform to strict international frameworks, such as the EU AI Act, GDPR, and localized digital privacy mandates. Make sure your processing loops line up with current legal requirements by keeping up with our analysis of AI Regulation.
7. Frequently Asked Questions (FAQs)
Can AI systems completely replace traditional data analysts?
No. Instead of replacing human analysts, AI frees them from tedious tasks like copying data and formatting cells. It elevates their role, turning them into strategic decision-makers who evaluate automated insights and implement high-level business optimizations.
How do conversational interfaces prevent data misinterpretations?
Elite automated systems display the step-by-step logic and the underlying code (such as SQL or Python) used to pull a result. This absolute transparency lets human operators quickly verify how a metric was calculated.
Is automation viable for small companies with limited budgets?
Absolutely. Platforms like Polymer Search, Akkio, and Zapier offer accessible, low-cost pricing models that enable agile startups to launch advanced analytics pipelines without needing massive enterprise infrastructure budgets.
8. Conclusion: Designing Your Analytics Roadmap
Relying on manual data collection and static spreadsheets is an operational risk in today’s fast-moving business climate. Transitioning to an automated, AI-driven reporting pipeline ensures your leadership has immediate access to real-time, actionable insights that drive growth.
To scale this successfully, pinpoint a high-frequency reporting workflow, automate its data ingestion path using an agile cloud setup, build in automated validation checks to guarantee accuracy, and deliver those insights right to your team’s daily channels.
Discover more step-by-step guides, comprehensive technical reviews, and innovative automation frameworks at AI Automation Hacks.